Power Management[]
Power management is critical to a colony's survival in Planetbase.
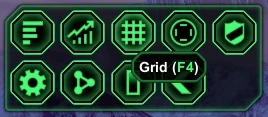
The Grid report screen (accessed pressing F4 key or via the "Base Management" button)

then the "Grid" button shows current real time Electricity Statistics.
Power Generation[]
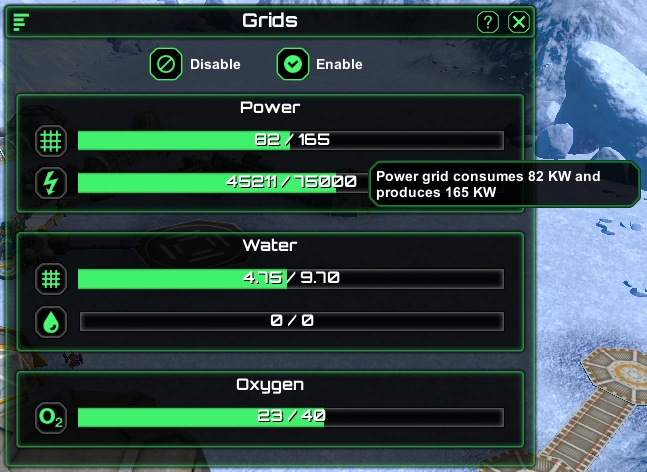
Hovering the pointer cursor over the power grid picture to the left of the horizontal bar chart shows some very important power usage information.
- Power Grid Consumption in kW
- Power Grid Production in kW
When it is night time and the solar power generators are not producing power and if there is no wind or you have no Wind generation. Then you will typically be consuming more power than is being generated. This adds the summary comment in brackets of (Overloaded)

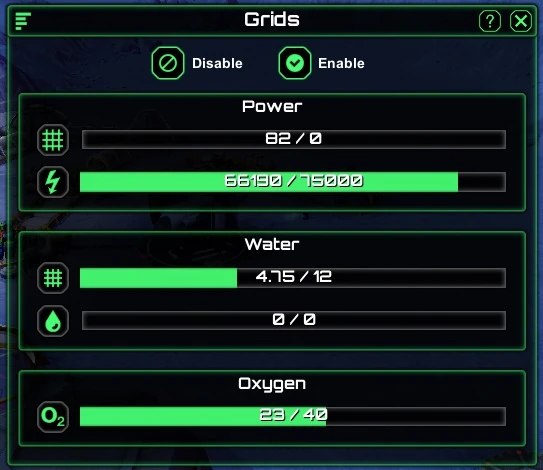
Power storage[]
Hovering over the pointer cursor over the power storage picture to the left of the power storage horizontal bar chart shows some very important power storage information. Two numbers separated by a slash.
- The first figure is current power storage. This figure represents Watts of power.
- The second figure is the maximum storage capability of your base.

Reading the relationship between Power Generation and Power Storage[]
The power storage figures are shown in Watts. This may be confusing as all other values are typically shown in kW (KiloWatts or thousands of Watts).
The bar graphs are read as an indicator of capacities from the left to the right.
If the Power Generation graph is fully highlighted to the right then your base is at maximum power generation.
If your Power storage graph is fully highlighted to the right then your base is at maximum storage.
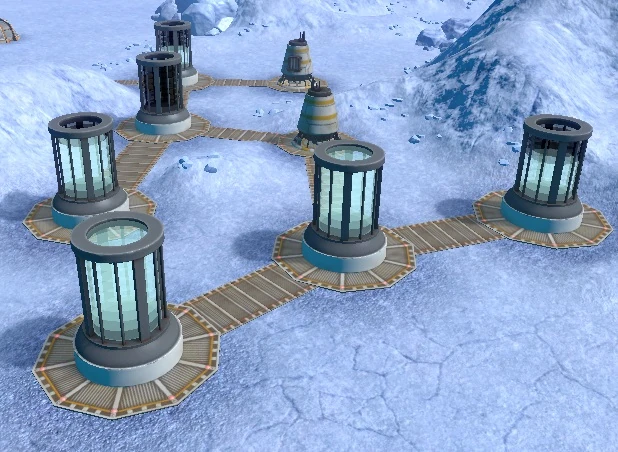
You can also glance at your power storage devices in your base and see the lighted levels to get an indicator of how full each or all devices are too.

Graphing your bases power balance trend[]
A power balance trend graph is available by navigating through the "base management" button and then "Charts" button or press F3.
Holding the "Ctrl" button and press on the power storage symbol to show your power storage trend chart.
This graph is more critical than the "Grid" report discussed above because it shows the change over time whereas the Grid report is an instant look at statistics.
How to read the power storage trend chart[]
The power storage balance chart[]
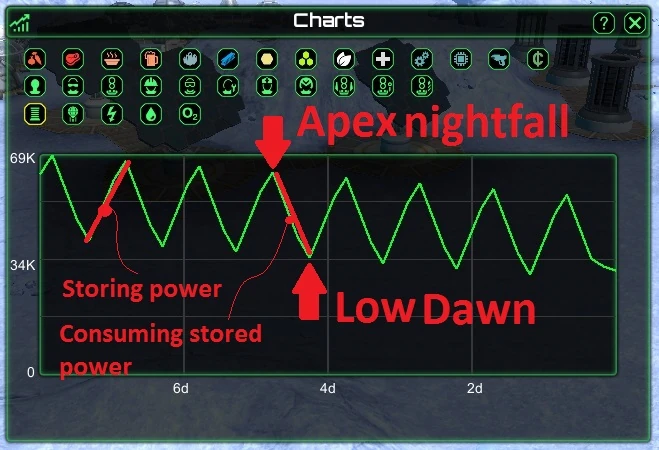
You should see a wavy line progressing across the chart. The vertical Y axis shows the power level in kW which is labelled as "k" to confuse you. The horizontal X axis is a representation of time showing the last 8 days.
Your base ideally should have a charge and deplete cycle occurring representing the cycle of charging up and storing power during the day and discharging any excess stored power during the night.
If you build only solar panel power generators you will achieve this. If you add to your power generation with wind power generators or only use wind power generators you will see a more erratic trend.
The lows and the highs[]
The depressions shown are the end of the draw down cycle when power is consumed from the storage devices over the night time. As your base uses more power these depressions will move closer to the base of the graph. If the depressions reach the 0 line your base will shut down due to lack of power.
The apex or top portions of the lines shows when charging during the day finishes. They typically fall off a little as the sun goes down. When this line reaches the top of the graph it shows that the power storage devices a fully charged and cannot receive any more power.

Being efficient[]
The power Balance chart shows generation change and shows how solar and wind power generators can reduce the amount of power they produce as the wear out. We fix this by using spares to maintain the power generators.
That inefficiency of generation has to be accounted for when your building generators and storage. The Power storage chart helps you to get this right. How you do this is to build enough generation that your storage can be charged up and have more power than you draw down in a typical night. The extra power storage is the amount you think you will need to account for the times the power generators are not operating fully to capacity.
E.g you might have one Massive solar panel generating 40 kW. You might have an educated guess that the panel gets fixed when they reach a "Good" status which is about 75% of full output.
So lets say all your panel is at 75% output so we add 25% to our night time base power consumption as a safe storage amount so as to get through to the morning.
We build the large power storage devices which hold 12.5 kW each. So 40kW power generation plus 25% is (40 x 1.25 = 50) 50 kW that we want.
50kW will be stored by (50/12.5 = 4) 4 power storage devices.
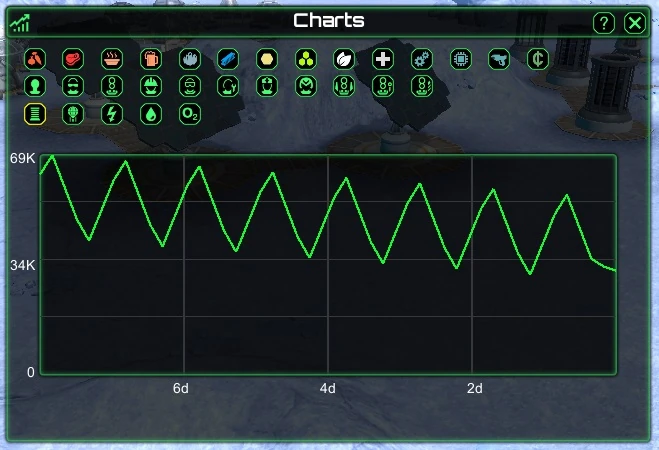
Here is an example of a base with four Massive solar collectors which isn't quite enough to recharge the storage devices. As you can see the storage is diminishing and the base will run out of power eventually. Some of the reduction in power occurs due to degradation of the panels.
TIP: If your seriously running out of power and you need to re balance in a hurry... then turn off your space port or landing pads... they use large amounts of power.

With the addition of one small or in this case a medium solar panel it is enough to balance the power to a power gain situation as opposed to diminishing storage. The panel was added 2 days after the chart is shown. You can see the storage is now being fully charged by nightfall.
